
Dive deep into this powerful Symmetrical Triangle trading setup! In this video, we break down one of the most explosive chart patterns that often appears before big market moves. You’ll discover how to spot, trade, and profit from a symmetrical triangle while keeping risk under control.
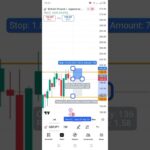
Using a real EUR/JPY forex example, we show how converging trendlines form lower highs (LH) and higher lows (HL), building pressure for the next breakout. In this case, momentum hints at a bearish breakdown—but we’ll also cover the upside scenario so you’re ready for both outcomes.
⚡ Will EUR/JPY explode higher or collapse lower? Watch this step-by-step analysis to see the exact trading plan, breakout targets, and risk management tactics every trader should know.
Key Topics Covered in This Symmetrical Triangle Trading Video:
What is a Symmetrical Triangle? Full Pattern Breakdown
Spotting Lower Highs & Higher Lows to Confirm the Triangle
Step-by-Step Trade Setup: Entries, Stops & Take Profits
Using the Triangle’s Height to Project Breakout Targets
Symmetrical Triangle Strategy on EUR/JPY Forex Charts
Bullish vs. Bearish Breakouts: Which Side to Trade
Bearish Momentum & Breakdown Triggers Explained
Risk Management for Triangle Breakout Trades
Price Action Strategy for Forex, Stocks & Crypto
Keywords for SEO:
Symmetrical triangle, symmetrical triangle pattern, how to trade a symmetrical triangle, forex symmetrical triangle, EURJPY triangle pattern, breakout trading strategy, bearish chart pattern, technical analysis symmetrical triangle, forex trading patterns, triangle breakout strategy, price action trading, support and resistance triangle, consolidation breakout, trading triangle setups, day trading chart patterns, swing trading symmetrical triangle, forex triangle breakout, EURJPY market analysis, triangle price action strategy, breakout confirmation trading.


Measured move is usually equals the base of the triangle.. no need to cut your profit to early.