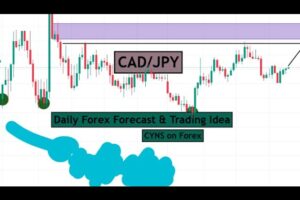
Market Observations: CAD/JPY has demonstrated a sustained bullish trend. However, the monthly timeframe indicates the pair is overextended. Furthermore, a double top pattern on the 1D chart suggests a potential retracement to the 50-61.8% Fibonacci levels. This zone could provide the necessary liquidity for major market players to accumulate long positions.
Trade Strategy:
Short Entry: Consider a counter-trend short entry at the current price level with a stop above the highs. 1:1 RR.
Buy Entry: Target a buy entry near the 61.8% Fibonacci retracement level to capitalize on potential long positions initiated by larger institutions. SL at the lows and targets as mentioned in the video.
➡️ Unlock 30 Days of FREE VIP Signals and Tradingview Indicators!
🔗
➡️ Risk Management (video):
➡️ Understanding Support and Resistance (video):
➡️ Why NOT to trade into News Events
➡️ Trend Continuation Strategy:
➡️ How To Trade Trend Reversals:
➡️ Our Linktree: 🔗 Link:
➡️ Ready for a Prop Firm Challenge? See who we recommend:
🔗
➡️ Join our Public Telegram Signals Group for Engaging Content
🔗
➡️ Join Tradingview for Comprehensive Market Insights and Analysis:
🔗
➡️ Recommended Fx Brokers:
Discover How Pepperstone Could Reward You with up to $5000:
🔗
Weltrade: 🔗
Fusion Markets: 🔗
Important Disclaimer: The information presented here is for educational purposes only and should not be construed as financial advice. Trading carries inherent risk, and proper risk management is essential. Capital preservation remains paramount.
Note: AI may have been used to help generate some of the content for this video description. The contents of the video however is entirely organic.


コメントを残す