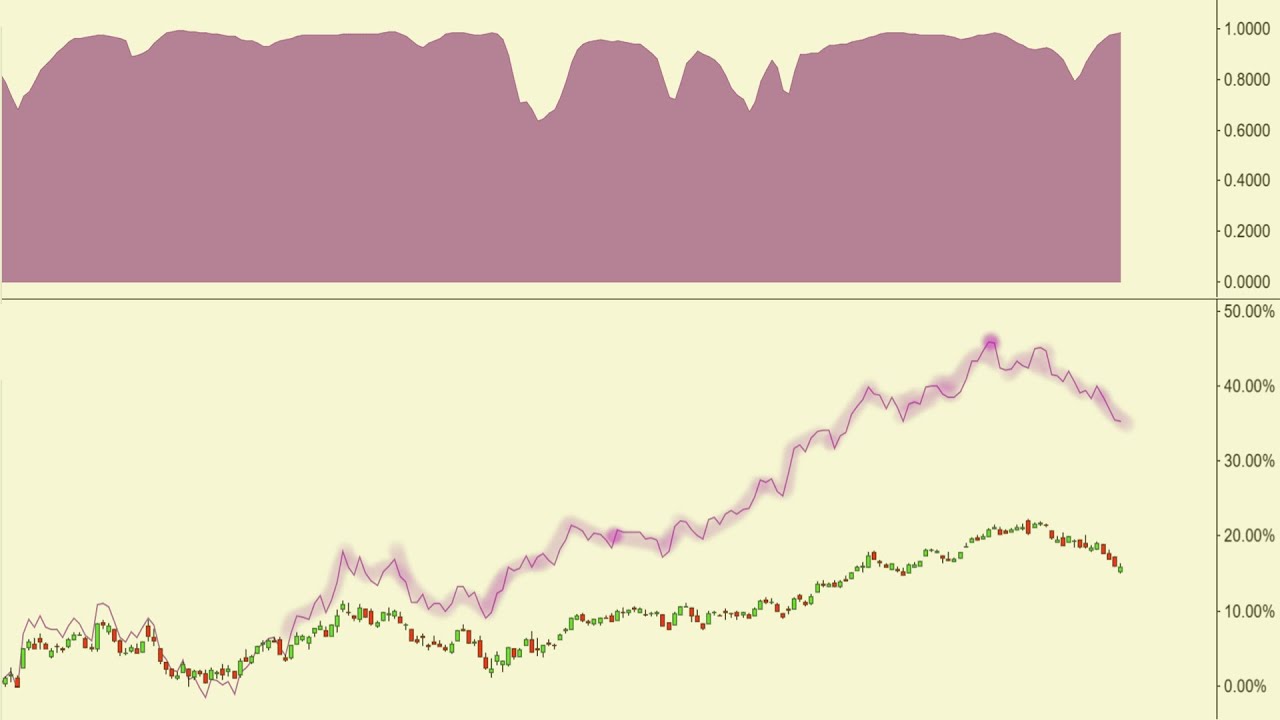
This is a series explaining how to use the Correlation Coefficient Indicator .
Understand what the Correlation Coefficient Indicator is through real chart examples.
Learn how to apply the Correlation Coefficient Indicator to analyze charts and see the pros and cons of this the Correlation Coefficient Indicator and which conditions are preferred and unsuitable for its use.
Full series at:
For more on trading, investing, charting analysis, and helpful information on the stock markets, currencies, and commodity markets, visit
Important and helpful resources for your benefit ↓↓↓
Important disclaimer & disclosure for content presented by Ascencore:
Enter your pick for a chart you want analyzed here so it doesn’t get missed.
View more extensive chart analysis examples.
I could’ve used this when looking into getting a new computer, especially for trading.
Making the technical topic easier so you don’t waste time and money researching.
Experience in the markets takes a lot of time, trial, and error. Realistic chart example can help save time
Risk management is common talk in trading and investing, but it is not talked about much in the context of disasters and emergencies. Here’s a small reminder that you can prepare but don’t need to go overboard like the world will end.
Copyright © 2023
Produced by Ascencore


Full series at:
For more on trading, investing, charting analysis, and helpful information on the stock markets, currencies, and commodity markets, visit