Telegram Free signal group:
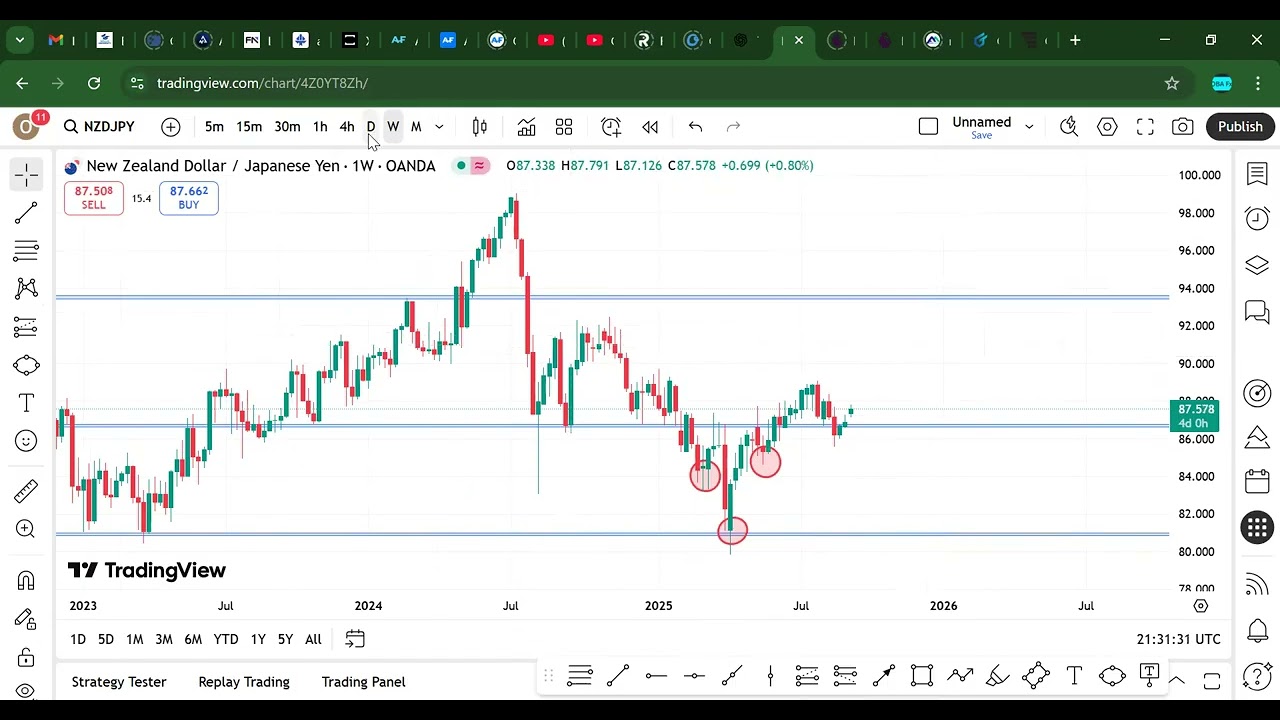
In this video, we break down the NZDJPY currency pair step by step using a pure price action trading strategy. No indicators—just market structure, candlestick behavior, and clean chart analysis. With a top-down approach, we start from higher timeframes and drill down to the lower charts for sniper trade setups.
Here’s What You’ll Learn in This Breakdown:
🔹 Trend Lines – Mapping the overall structure and spotting reversals
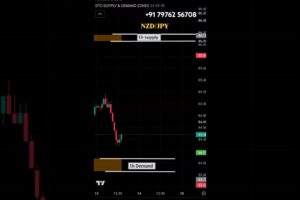
🔹 Support & Resistance – Identifying key reaction zones on NZDJPY
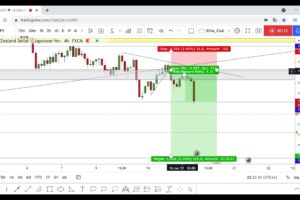
🔹 Fibonacci Retracement Tool – Finding sniper pullback levels for precise entries
🔹 Top-Down Flow – From Weekly & Daily charts into H4, H1 & M15 for execution
🔹 Price Action Confirmations – Using candlestick patterns to reduce fakeouts and boost accuracy
This NZDJPY top-down analysis is perfect for both swing traders capturing long-term forex moves and intraday traders seeking tighter entries.
🚀 Trade NZDJPY with confidence using clean, structured price action.
👍 Like this video if it added value
💬 Share your NZDJPY trade setups in the comments below
🔔 Subscribe for more Forex & Deriv Synthetic Indices price action breakdowns
#NZDJPY #NZDJPYAnalysis #ForexTrading #PriceActionStrategy #TopDownAnalysis #SupportAndResistance #TrendLines #FibonacciRetracement #PriceActionTrading


コメントを残す