This is our detailed video on market analysis for Forex pairs. Today we will be analysing AUD/JPY pair so let’s start.
First of all we will start from a daily time frame to understand the overall trend of this pair. For simplicity we are also adding moving averages to the chart because we are seeing it on a daily time frame, so will quickly have a look at what moving averages are enabled, we have 50 and 200 day EMA here.
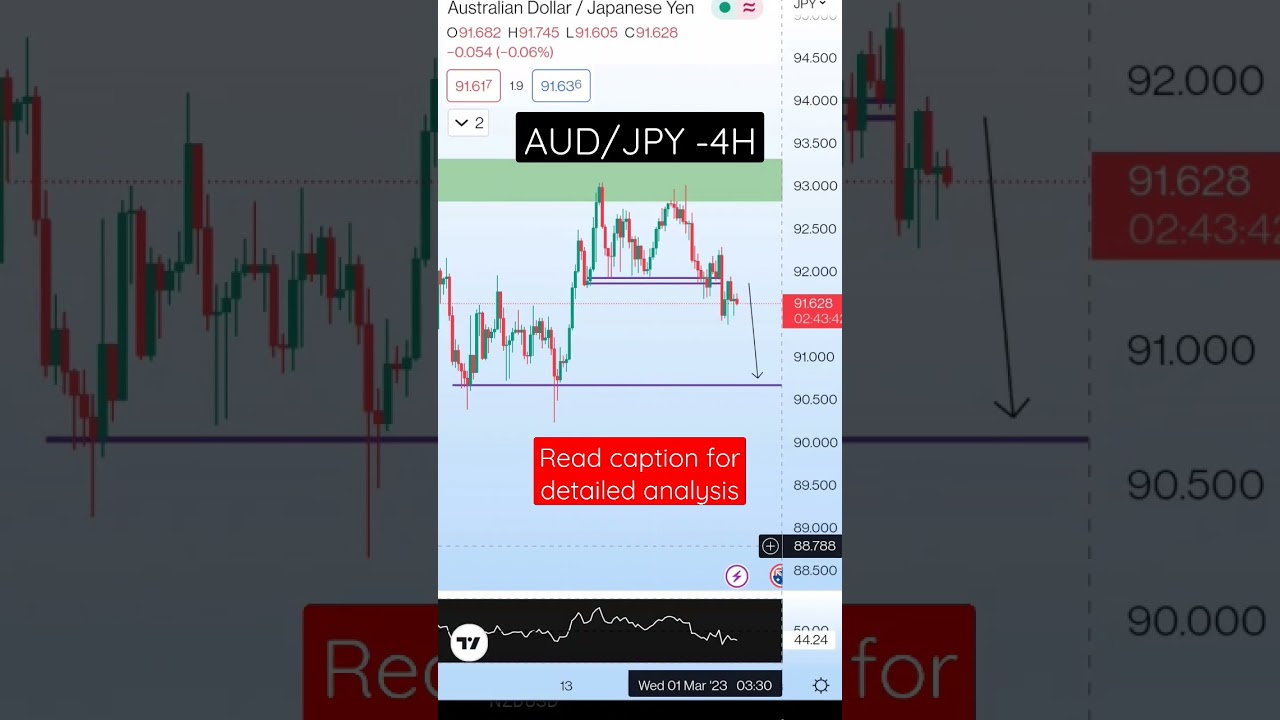
As you can see ondaily time frame, the pair is facing a resistance, asmarked in the green, is the supply zone. So now, if we move to the 4h time frame we see that it has made a head and shoulder pattern.
So once the neckline is broken we can successfully take target of the nearest swing low. To enter our trade, we must wait at least one hour candle to close below the neckline of head n shoulder pattern.
Our first target will be the nearest swing low marked here, on 4H time frame.
#audjpy #forexanalysis #forexpairs #forex style #forexcharts #forextechniques #forexstrategy #forexchannel #forexaccount #forexlifestyle #forexfreedom #lifefreedom #financialmarkets #intradayforex #forexmentor #forexexpert #forexsouthafrica #forexpips #forexfrance #forexdubai #forexmentorship #forexclass #forexlearning #forexusa #forextips


Trade active