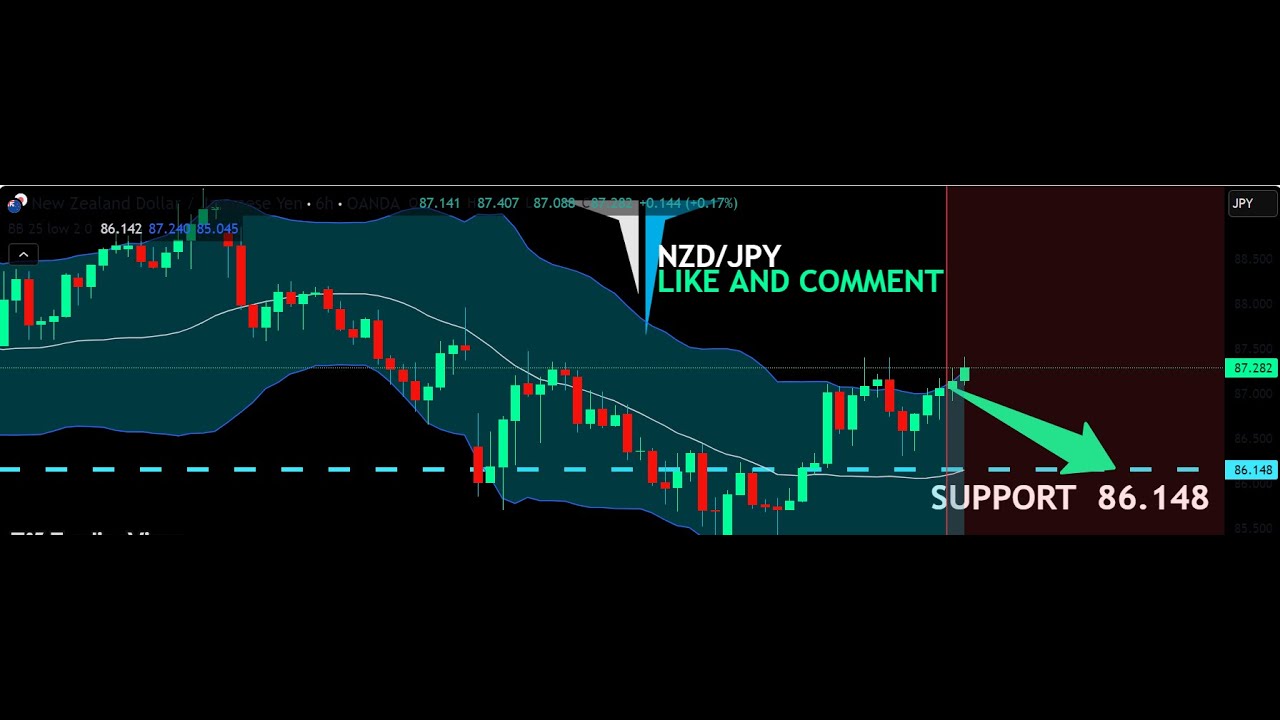
NZD/JPY currency pair, which is currently exhibiting a local downtrend based on the previous 1W red candle. Despite this, the pair is moving upwards in the 6H timeframe, creating a potential trading opportunity.
The market appears overbought as the price is near the upper Bollinger Band (BB) indicator, signaling a possible reversal. This upper BB line is acting as a strong resistance level, and traders should be cautious about potential selling opportunities. Based on this technical setup, we are looking to sell the pair with an expected price target of the 86.148 area, a key support zone.
If the price reaches this level, traders must assess whether it breaks below or bounces back. A break below 86.148 could indicate further downside momentum, while a bounce could suggest temporary strength in the market. As always, risk management is crucial when trading in such market conditions.
Stay updated with our latest trading insights and strategies. Subscribe to our channel and turn on notifications for more real-time market analysis. Happy trading! 🚀


コメントを残す