The latest weekly forex forecast for the week of November 11 – November 15, with in-depth analysis of supply and demand zones, trend insights, and higher timeframe strategies. This forex forecast will guide you on the best times to trade and when to stay out of the market. Learn how to leverage key higher timeframe supply and demand zones to trade effectively. Don’t miss this week’s forex forecast to optimize your trading decisions and enhance your trading strategy!
Master supply and demand! 📊📚
👇What is included in the membership?
✅ Daily Chart Analysis
✅ Video Lessons A-Z
✅ Sunday Livestream Forecast
✅ Sunday Strategy Zoom Session
✅ Daily Market Breakdown Video
✅ Private Discord Chat
✅ COT Report Spreadsheet
HOW TO JOIN THE TEAM👇
▶︎
▶︎
▶︎
💎LIFETIME ACCESS 💎
In this forex forecast I have identified all of the important supply and demand zones created by large institutions that you should also be watching for this upcoming trading week! You can use this weekly forex forecast to trade confirmation entries, or simply use the supply and demand zones I show in the forecast, to help you with your own trading strategy! AND If you want DAILY MARKET BREAKDOWN VIDEOS, the Diamond Membership is what you are looking for!
In this weekly forex forecast we will analyze the DXY, EURUSD, AUDUSD, USDJPY, GBPUSD, USDCAD, USDCHF, Gold(XAUUSD), & Oil. I will forecast any market for you every Sunday in the Silver Membership!
*FOREX FORECAST TIMESTAMPS*
0:01 Weekly Forex Forecast Intro
0:02 US DOLLAR forecast
2:50 EURUSD forecast
5:36 XAUUSD (GOLD) forecast
9:20 USDJPY forecast
13:28 GBPUSD forecast
16:30 USDCAD forecast
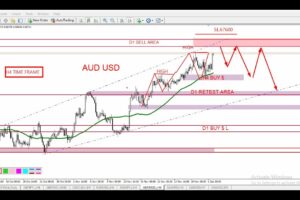
18:28 AUDUSD forecast
20:18 USDCHF forecast
22:02 OIL forecast
Stoic Trading Psychology Podcast
▶︎
Supply & Demand Trading Tips Playlist
▶︎
Follow me on Social Media:
▶︎
▶︎
DISCLAIMER:
This video expresses my personal opinion only. Trading the financial markets involves risk and is not suitable for all investors. Before deciding to invest in foreign exchange or another financial market, you should carefully consider your investment objectives, level of experience and risk appetite. I am not responsible for any losses incurred due to your trading or anything else. I do not recommend any specific trade or action, and any trades you decide to place are your own.
100% of the ad revenue generated from my Weekly Forex Forecast videos gets donated to my local Hospice Residency
Backround Music: Chillpeach – On The Top
#weeklyforexforecast
#forexforecast
#forexanalysis
#forex






Thanks buddy! Have a great trading week!
I am bullish gbpusd.
1:53 I can tell you why the dollar is bullish, I know about the economic stuff. First: the debt repayment cycle. Second: the end of another industrial revolution. For the first part, you can watch the video of George Gammon titled Peter Schiff is WRONG About the Dollar released 1 month ago. For the second part you can find out my comment on the video of Alessio Rastani titled You Wont Believe What This Chart Predicts for Stock Markets released 11 days ago. Search for my comment there, it is very long (like 5 minute read) and it explains why we are going to enter deflation, deflation is when economic activity stops , everyone sells their assets and hoards cash, this is bullish for the dollar. Basically, the whole decade will be bullish for the dollar, and probably the decade of 2030-2040 too. After that , it is very difficult to predict.
The rise of the dollar on the elections week doesn’t have to do very much with elections, DXY would rise anyway, but because Trump is a bad manager (he bankrupted lots of his companies) the impulse on the dollar was given last week. Keeping things simple, just buy the DXY on dips, but the thing is, there won’t be much dips until 2025, because the whole 2024 was wasted and only 2 months left to close the year.
0:23 yes, we will. My target for EURUSD close for November is 0.9800 , you are looking at weekly charts of DXY, but pull a quarterly chart on bar chart site and you will see the potential for the upside. It is evident that 100 level was tested enough so now the market is headed for a test of 115, but because the whole year was traded in a tight range, the remaining two months (nov + dec) will account for the entire year. But since the test level DXY is headed (115) belongs to year 2022 the candlestick for year 2024 can overshoot it (that’s the logical thing to do if the lower border of the range doesn’t break). If you have a market that broke above 100 in this decade , tested 100 and the top of the range was +15 points, what is the possible next top? It is twice the current range as a minimum target because market loves symmetry. So 15 + 15 = 30. 100 + 30 = 130 , so the DXY is headed for 130. Every point on DXY accounts for about 120 points on EURUSD , this means the maximum target for EURUSD on the downside is 25*120 = 3000 , 1.0700 – 0.3 = 0.77 , this is where EURUSD is headed in 2025, therefore it can close 2024 at some level above 115 , I don’t know at 0.90 or so. Basically, within next 2 months we will be breaking parity, and give the signal to everyone that 2025 will be also bearish. Download A1 M Yearly indicator for MT4 and you will see the picture from a higher perspective on the yearly chart.
GBPUSD demand zone on W1 tf might hold, it’s aligned with MN bullish trendline
How are you getting the prices on the Bars you using for the S&D zones.. I used rectangle to draw mine…. What do you use to get the prices on them???
insightful staff indeed.
Thank you for your analysis.
From Indonesia