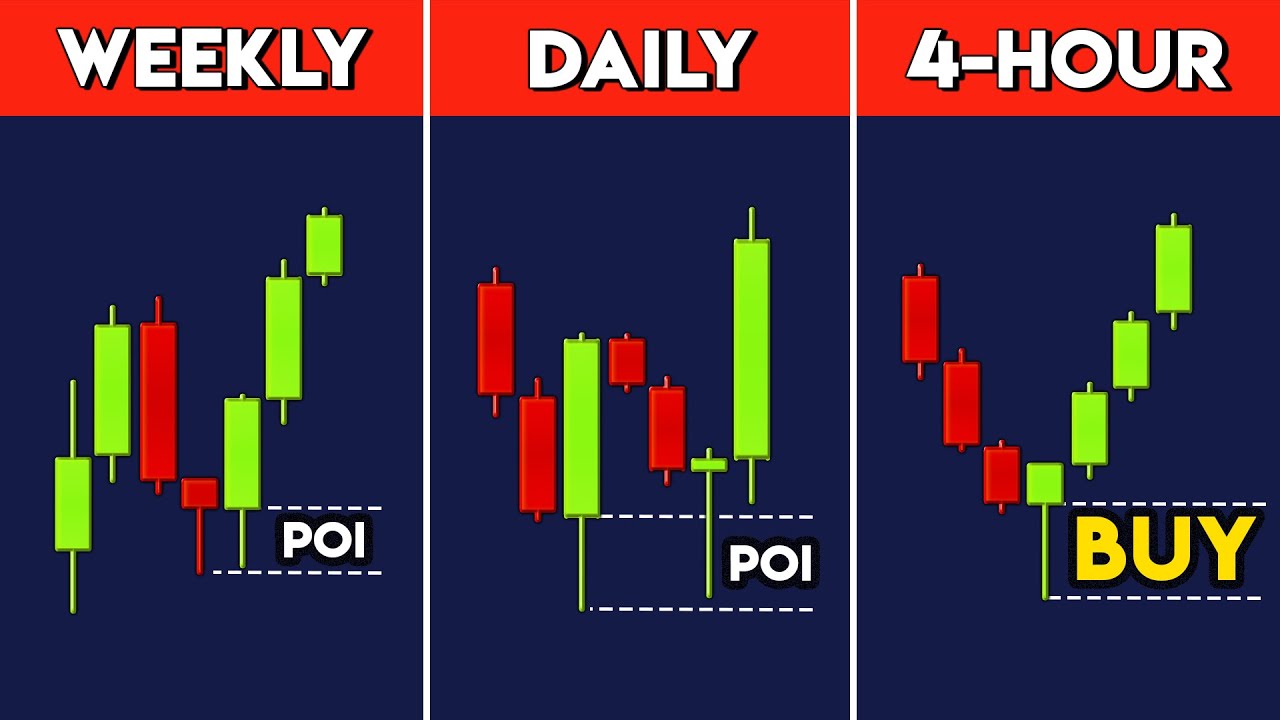
In today’s video, we’re breaking down how to improve your trading analysis with Multi-Time Frame Analysis using a Top-Down Approach, combining Price Action with TradeLean’s strategy for clarity and precision. Top-Down Analysis is all about starting from higher time frames to gauge the overall market direction, then zooming into lower time frames to fine-tune entry and exit points. This approach helps traders avoid cluttered charts by focusing on key levels and zones that actually matter. Using multiple time frames has several benefits. First, it clears up directional confusion. When the market seems indecisive on a lower time frame, zooming out to a higher one often reveals the true trend, helping you avoid getting caught in short-term noise. It also improves accuracy by allowing you to see major support or resistance zones from higher time frames, which influence price action on lower ones. This way, you can set more informed targets and avoid unnecessary risks. Lastly, using lower time frames to refine entries around Points of Interest (POI) offers better precision and a stronger risk-reward ratio. With TradeLean’s Top-Down Analysis, we start on the weekly chart to mark major levels that could impact price movement. Next, we move to the daily chart to identify additional significant zones and highlight any confluence with weekly levels. Finally, we zoom into the 4-hour chart for primary analysis, observing price action and setting entry and exit points. This structured approach ensures each trade setup aligns with the overall trend and keeps your charts clean. In our real-world examples, we’ll apply this strategy to EUR/USD and CHF/JPY, showing how to spot high-probability Points of Interest, identify potential trade setups, and gain confidence in market direction. By examining market structure and price imbalances, we’ll demonstrate how TradeLean’s tools make it easier to make clear, well-informed trades. When identifying structural price levels, treat them as zones instead of precise lines since price rarely reacts at a single point. Confirmation is also key — using lower time frames to confirm higher time frame levels filters out false signals, allowing for more effective setups.This video will show you how to understand market direction, find key trading opportunities, and make your chart analysis easier and more effective with TradeLean’s strategies. Be sure to like, subscribe, and leave a comment if you have questions or feedback. Your engagement helps us create more content for our trading community. Stay connected at TradeLean.com, where you can sign up for our newsletter to get exclusive content and insights. Follow us on social media for daily tips, strategies, and market updates.
00:00 Introduction
01:17 Combining Multiple Timeframes
05:18 TradeLean Top-Down Analysis
06:04 TradeLean Top-Down Analysis Example
08:29 Three Tips Identifying Levels
08:59 Five Strength Factors of Price Level or Zone
09:52 TradeLean Top-Down Analysis Example (Continued)
11:55 Closing
TradeLean Top-Down Analysis Strategy:
#topdownanalysis #topdownanalysisstrategy #besttopdownanalysisstrategy #forextrading #trading #cryptotrading #tradingforbeginners #tradingstrategy #trading #tradingtips
#forex #topdownanalysis #priceactiontrading #forexbeginners
DISCLAIMER: I am not a financial advisor. Trading and investing carry risks, and you may lose money. The information shared in this video is for educational purposes only and should not be considered financial advice. Always consult with a licensed financial advisor before making any investment decisions. Your support means everything to me, and I truly appreciate it. Thank you for being part of this journey!


コメントを残す