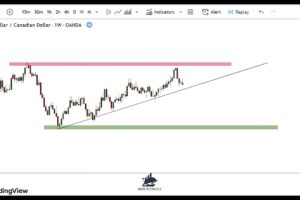
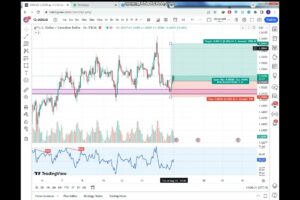
In this video, we carried out price action chart analysis on 7 different chart analysis to get you prepared for the week ahead. These charts includes Gold, Nasdaq, EUR-JPY, Crude Oil, EUR-USD, CAD-CHF & GBP-USD
Learn To Trade Forex Like A Professional;
Join Our Free Discord:
Follow Us On Instagram:
Visit our Website:
#forex #forextrading #gold #xauusd #euraud #eurusd #chfjpy #gbpjpy #audusd #priceaction #technicalanalysis #forextrader
00:00 Intro
00:45 Gold
03:12 GBP-USD
06:00 Crude Oil
08:39 EUR-JPY
11:25 Nasdaq
13:22 EUR-USD
15:43 CAD-CHF


Love your analysis Sir. God bless you but pls make your chart clearer in your videos so that we can see the candlesticks more clearly
You enter your trades on 1h. For instance when there is a bullish breakout , a good green candel closing above , you enter. But what timeframe is better for a conservative daytrader who needs more confirmations. Because just 1 single candel sounds risky.
Thanks in advance.
But then sir,dxy is currently bearish on intraday majourly 4hr so gold isnt making sense today
Thank you for this wonderful content. But if you would like to explain a little slower so that I can follow up with you. I will be thankful to you
I love your clear ananysis every week. Thank you !
I think I have to start taking my mind off correlations. Whenever I see Gold selling, I also think both EU and GU will follow suit.