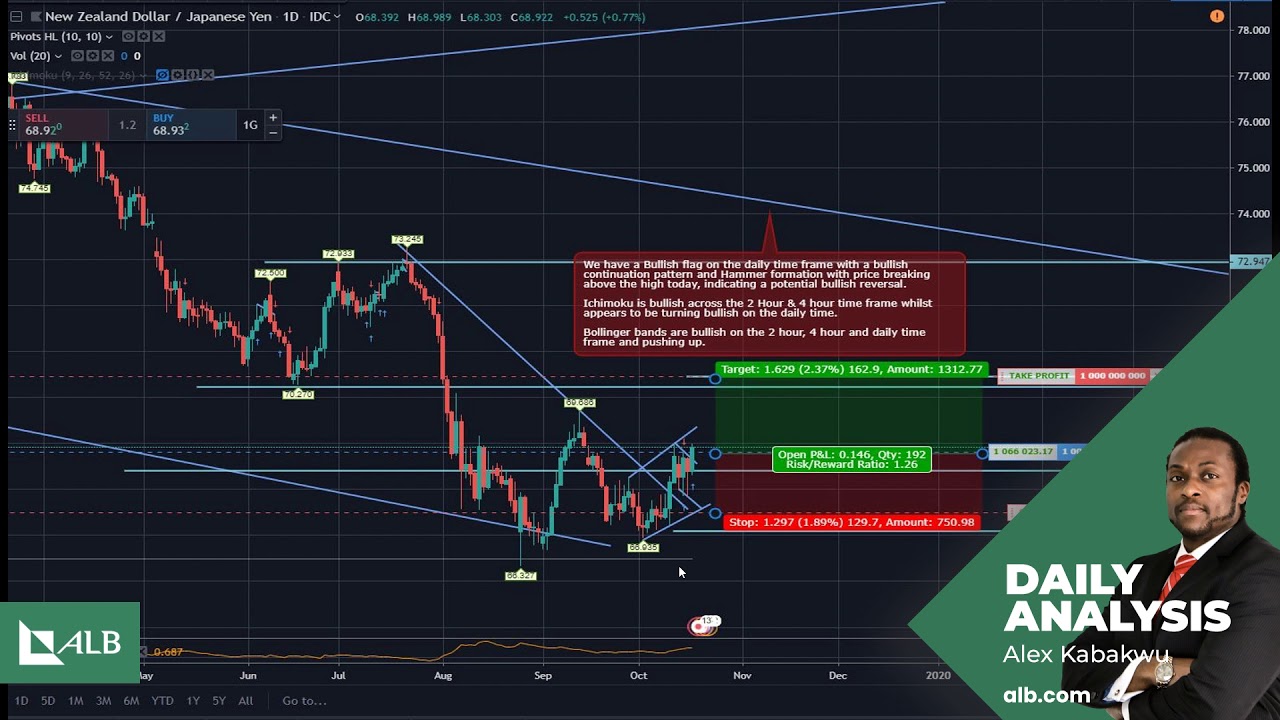
#chartoftheday #NZDJPY #analysis
Bullish flag on the daily time frame with a bullish continuation pattern and Hammer formation with price breaking above the high today, indicating a potential bullish reversal. Ichimoku is bullish across the 2 Hour & 4 hour time frame whilst appears to be turning bullish on the daily time. Bollinger bands are bullish on the 2 hour, 4 hour and daily time frame and pushing up.
82.57% of retail investor accounts lose money when trading CFDs with this provider.


 EUR/USD USD/CAD USD/JPY EUR/CHF GBP/USD AUD/NZD GBP/JPY BTC/USD Gold Silver Crude Oil #LiveSignals
コメントを残す