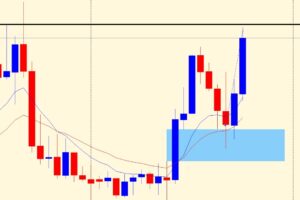
In this video, we will analyze the technical outlook for the USD/CHF currency pair using various technical indicators and chart patterns.
JOIN US on Telegram-
Firstly, we will start by looking at the daily chart of USD/CHF. From the chart, we can see that the pair has been in a downtrend with lower lows and lower highs being formed. The price is currently trading below its 50-day moving average, which indicates that the near-term trend is bearish.
Next, we will examine the support and resistance levels of the pair. The key support level for USD/CHF is at 0.9000, which has held the price from falling lower several times in the past. On the other hand, the key resistance level is at 0.9350, which has been a strong barrier for the price to break above.
We will also look at the Relative Strength Index (RSI) and Moving Average Convergence Divergence (MACD) indicators. The RSI is currently at 44, which indicates that the pair is neither oversold nor overbought. Meanwhile, the MACD is showing bearish momentum, with the signal line below the MACD line.
Lastly, we will analyze the chart patterns. USD/CHF has formed a descending triangle pattern, which is a bearish pattern that suggests a continuation of the downtrend. If the price breaks below the support level of 0.9000, it could trigger a further downward move toward the next support level at 0.8750.
In summary, the technical outlook for USD/CHF is bearish, with the pair in a downtrend and showing bearish momentum. The key support and resistance levels are at 0.9000 and 0.9350, respectively. The descending triangle pattern suggests a continuation of the downtrend, and a break below the support level of 0.9000 could trigger a further downward move. Traders should be cautious and wait for confirmation before entering any trades.


コメントを残す